Power BI
Case Study: Interactive Business Intelligence with Power BI
Explore how CycaSoft implemented an enterprise-grade Power BI solution to enable data-driven decision-making for a multi-location retail chain, driving operational insights and executive-level reporting.
Client
A large retail enterprise with over 200 store locations and multiple departments, struggling with fragmented reporting and data silos.
Challenge
Business stakeholders lacked real-time visibility into sales, inventory, and customer behavior. Manual reports were delayed and inconsistent across departments.
Solution Delivered
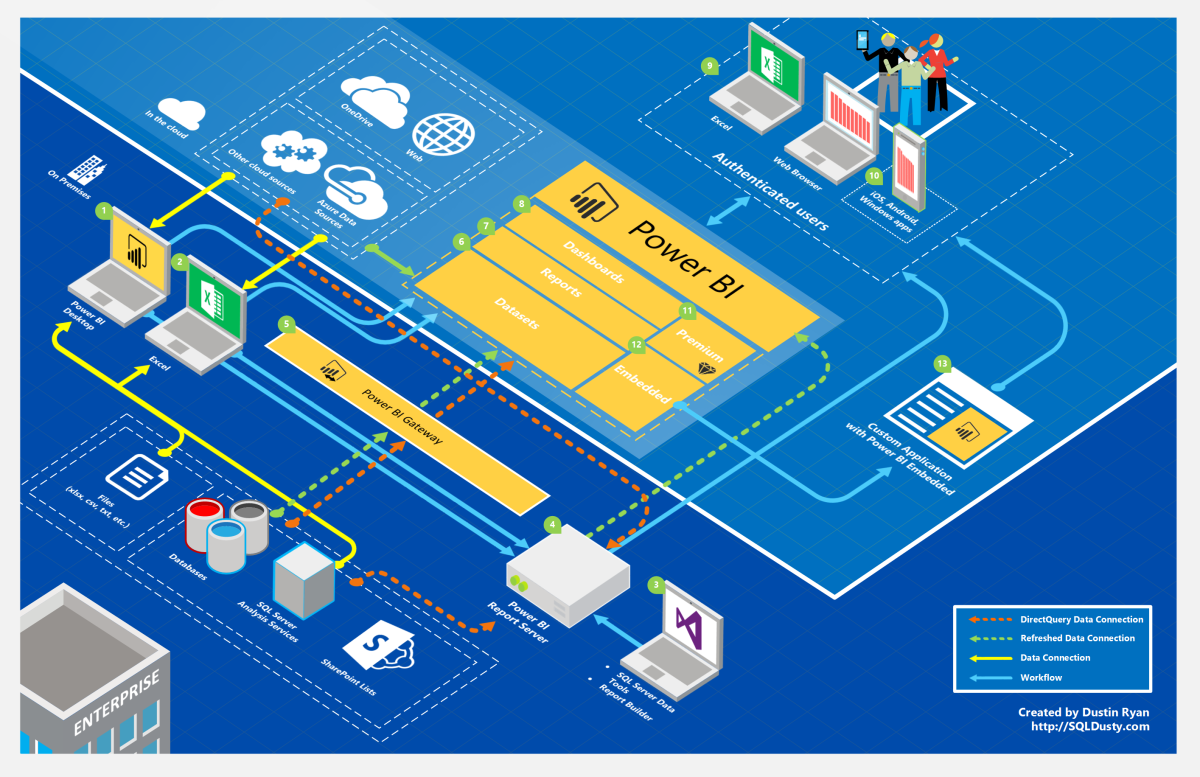
- Designed and deployed enterprise dashboards using Power BI
- Consolidated data from ERP, CRM, POS, and Excel sources via Power Query
- Built custom KPIs for sales trends, inventory turnover, and region-wise performance
- Configured row-level security (RLS) to control data visibility by role
- Published interactive dashboards to Power BI Service with automatic data refresh
- Integrated Power BI reports into internal apps using Power BI Embedded
Business Impact
- 90% reduction in reporting time through automation and self-service analytics
- Improved cross-departmental decision-making with unified, real-time dashboards
- Increased inventory optimization and reduced stockouts by 15%
- Empowered over 500+ users to make data-driven decisions via secure dashboards
Power BI Solutions Offered by CycaSoft
Predictive Maintenance
Monitor asset health and predict machine failures with Power BI visual analytics using integrated IoT data models.
Intelligent Document Insights
Visualize structured data extracted from scanned documents using Power BI dashboards and AI-driven dataflows.
Visual Inspection Reporting
Track image-based results and inspection summaries with Power BI image analytics reports.
Customer Support Insights
Analyze chatbot performance and customer sentiment using Power BI sentiment analysis visuals.
Fraud Monitoring
Visualize anomalies and suspicious activity trends via Power BI fraud detection dashboards.
Enterprise BI Deployment
Deploy scalable reports and KPIs using Power BI Service, Data Gateways, and Power BI Embedded.
Power BI Solutions Across Industries
Manufacturing
Production Efficiency & Downtime Dashboard using Power BI, SQL Server, and DAX.
- Live data from PLC logs and ERP
- DAX measures for OEE, cycle time
- Drill-through shift-wise reports
- Impact: 22% increase in line efficiency
- Impact: Identified top 3 downtime causes
Healthcare
Hospital Operational Dashboard using Power BI, HIS, and APIs.
- Dashboards for IPD/OPD, beds, discharge
- KPI indicators for ALOS, readmission
- Role-based access for department heads
- Impact: 15% ALOS reduction
- Impact: Real-time ICU/doctor allocation
Logistics
Shipment Tracking Dashboard using Power BI, Azure SQL, and ArcGIS.
- Route-wise delay heatmaps & fuel data
- DAX for idle time, fuel efficiency, ETA
- Embedded in Transport Mgmt System
- Impact: 18% faster transit time
- Impact: ₹3.2L/month saved on re-routing
Banking
Branch KPI & Segmentation Dashboard via Power BI and Core Banking data.
- CASA trends, loan performance visuals
- Clustering with RFM analysis
- Power BI Service for monthly reporting
- Impact: 12% more branch profitability
- Impact: Better targeted promotions
Insurance
Claims & Fraud Dashboard using Power BI, Dataflows & Python.
- YOY claim trend analysis, resolution rates
- Python-based fraud detection visuals
- Alerts for claim spikes & anomalies
- Impact: ₹1.5Cr fraud flagged
- Impact: 26% claim processing improvement
Real Estate
Sales Funnel Dashboard using Power BI and CRM Data.
- Lead funnel, drop-off, and conversion tracking
- Heatmaps for property demand by region
- Filters for agents, price, and property type
- Impact: 32% booking conversion growth
- Impact: Enabled dynamic pricing strategies